
Fig 3. The low-rank matrices from both RPCA and RP-RPCA.
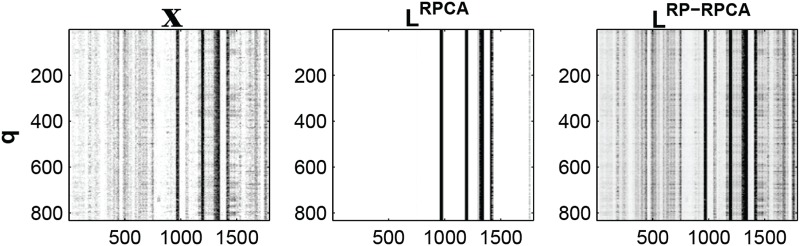
 is an input matrix and we choose m = n = 64 for the comparison (contrast represents activity of neuron. i.e., high contrast represents highly modulated neural activity and white color represents zero neural activity). (left) raw-data (center) low-rank component using RPCA and (right) low-rank component using RP-RPCA.