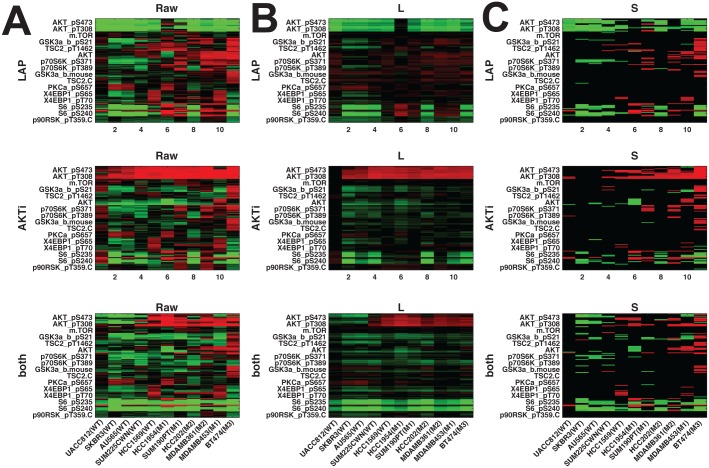
Fig 8. Application to RPPA data set.
x-axis represents time steps ([0.5hr 1hr 2hr 4hr 8hr 72hr] for Raw data / Low-rank (L) / Sparse (S) respectively): (A) raw data  (B) low-rank component L and (C) highly aberrant sparse component S using threshold (WT: wild type, M1: H1047R (kinase domain mutation), M2: E545K (helical domain mutation), and M3: K111N mutation in PIK3CA).

