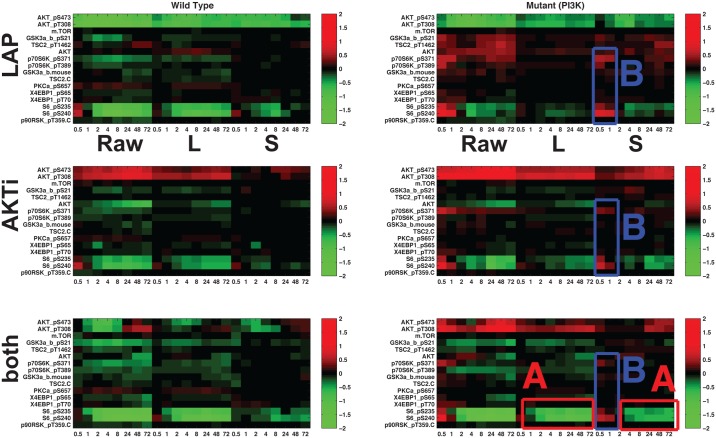
Fig 9. Heat maps showing average response based on both raw data and disentanglement result within subtype to targeted therapeutics in Fig 8: (left) HER2+/wild type, (right) HER2+/ PI3K mutant.
Each representation consists of average responses of raw RPPA, low-rank component and sparse component. Each row represents targeted therapeutics alone and in combination (LAP, AKTi, both). (A) In the PI3K mutation with applying both inhibitors, full inhibition of pS6RP is observed (B) the main difference between wild-type and PI3K mutant is the response of pS6RP and p70S6K.

