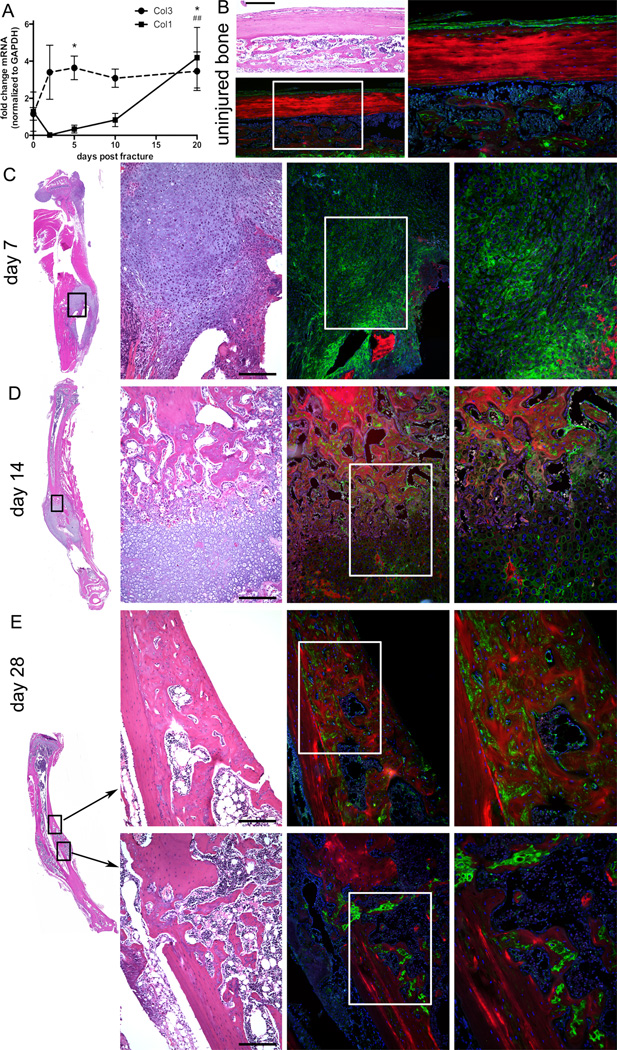
Figure 1. Col3 expression is upregulated by day two after fracture and remains elevated until at least day 28 after fracture.
Quantitative real-time RT-PCR was performed on fractured tibia of mice on C57Bl/6 background (n=4 or 5 per group) for Col1 and Col3 expression. Results are presented as the fold-change of mRNA normalized to GAPDH (mean ± SD), which was used as the endogenous control. Col3 is significantly higher than base line (0 days post fracture) at days 5 and 20 post-fracture (*p<0.05), while significant elevation in Col1 above base line did not occur until day 20 (##p<0.01). B–E. Bone H&E and Col3 immunofluorescent staining to show Col3 localization during fracture healing. Green: Col3. Red: Bone autofluorescence. Blue: DAPI. Scale Bars = 200 microns. B. 10× and 20× images of uninjured bone. × field of view is boxed in 10× image. C–E. Whole tibia, 10× and 20× images of day 7 (C) 14 (D) and 28 (E) post fracture callus. 10× field of view is boxed in whole tibia image, and 20× field of view is boxed in 10× image.

