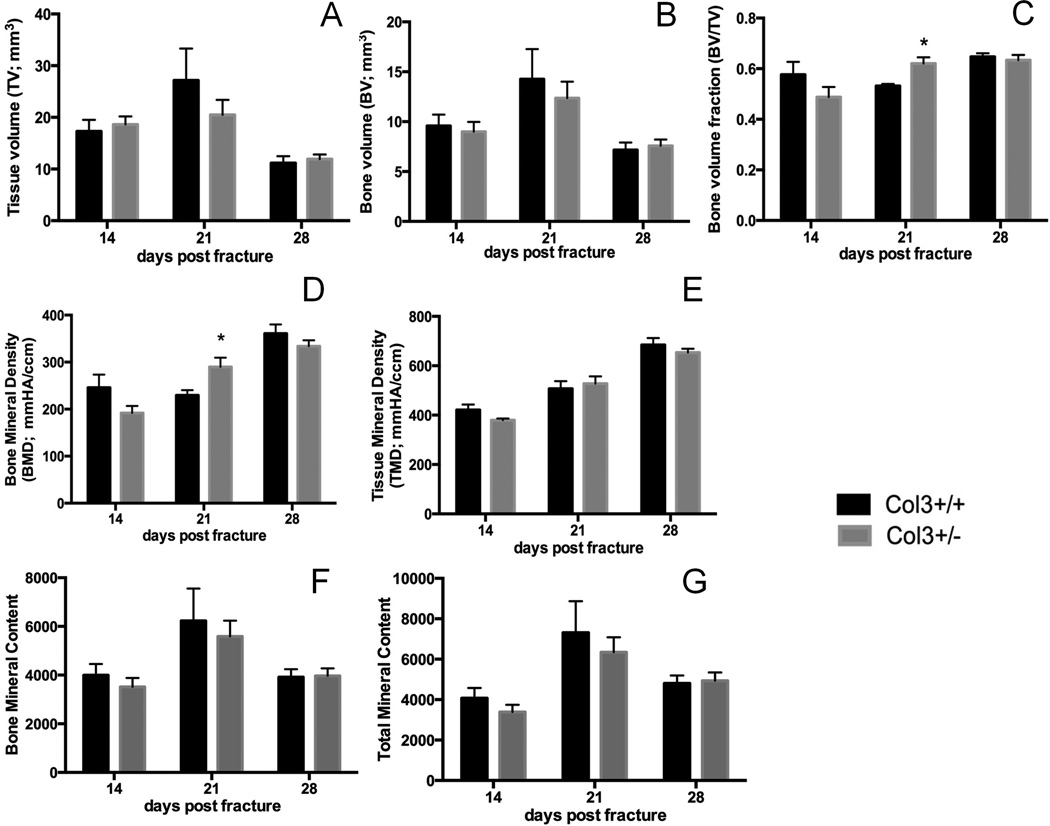
Figure 3. MicroCT analysis of tibial fracture in young adult Col3+/+ and Col3+/− mice.
Microcomputed tomography analysis demonstrates significant differences in bone volume fraction and bone mineral density at 21 days post fracture in Col3 wild-type (Col3+/+; black bars) and Col3 haploinsufficient (Col3+/−; gray bars) mice. (A) Quantification of total callus volume (TV), (B) bone volume (BV), (C) bone volume relative to total callus volume (bone volume fraction; BV/TV), (D) bone mineral density (BMD), (E) (callus) mineral density (TMD), (F) bone mineral content (BMC) and (G) tissue (callus) mineral content (TMC) at day 14, 21 and 28 after tibial fracture. (n= 8–10 per group). *p<0.05.

