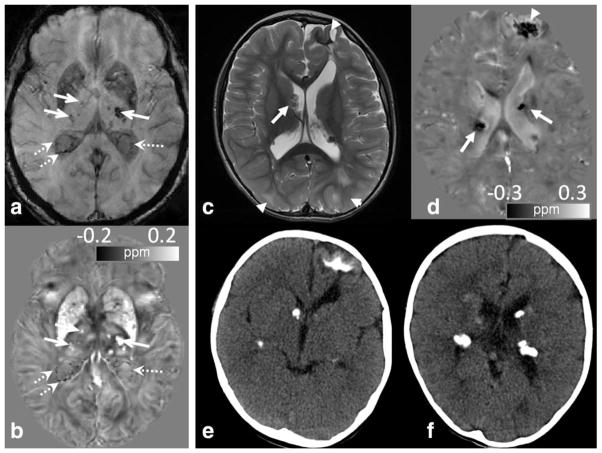
Figure 12.
QSM can differentiate calcification from iron deposit and veins. (a,b) An elderly volunteer shows numerous hypointense spots in the thalamus (solid arrows) and in the ventricles (dotted arrows) adjacent to veins and choroid plexus on T2*-weighted images (a). QSM (b) reveals hypointense calcifications (dotted arrows) in the ventricles which are clearly differentiated from the adjacent veins and iron deposition in the thalamus. (c–f) An 8-month-old male infant with tuberous sclerosis and multiple calcified dysplasias and hamartomas. (c) Numerous cortical/subcortical tubers, or dysplasias, (arrowhead) and subependymal nodules (arrows) were seen on the T2 FSE image. (d) Corresponding QSM image revealed dark signal associated with many of these lesions, which would be expected for calcification but not iron (arrows and arrowhead). SWI/QSM protocol of (c,d) is the same as Fig. 6. (e,f) This was confirmed by CT.

