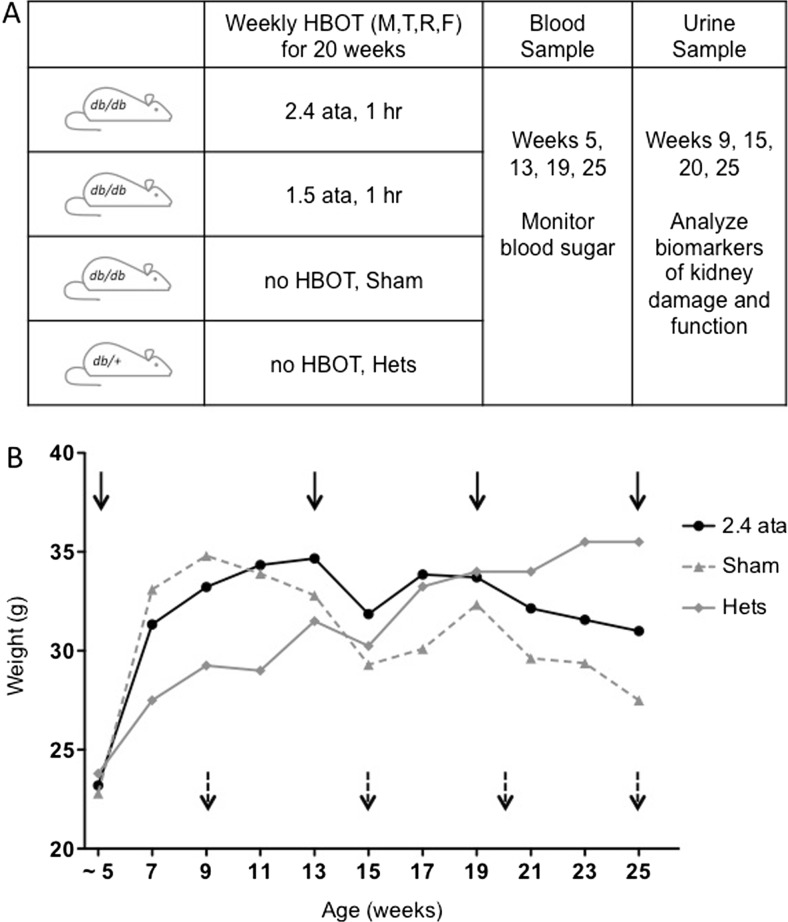
Fig. 1.
a Overview of the experimental protocol indicating the frequency and pressure of HBOT treatment. Also shown are the time points for blood (solid arrows) and urine (broken arrows) collection. b Average weekly weights over the duration of the 20-week HBOT regimen for the Hets, Sham, and 2.4 ATA groups. All groups are shown in Fig. S1. Weeks indicate animal age; for example week 5 is equivalent to week 1 of HBOT

