Fig. 5.
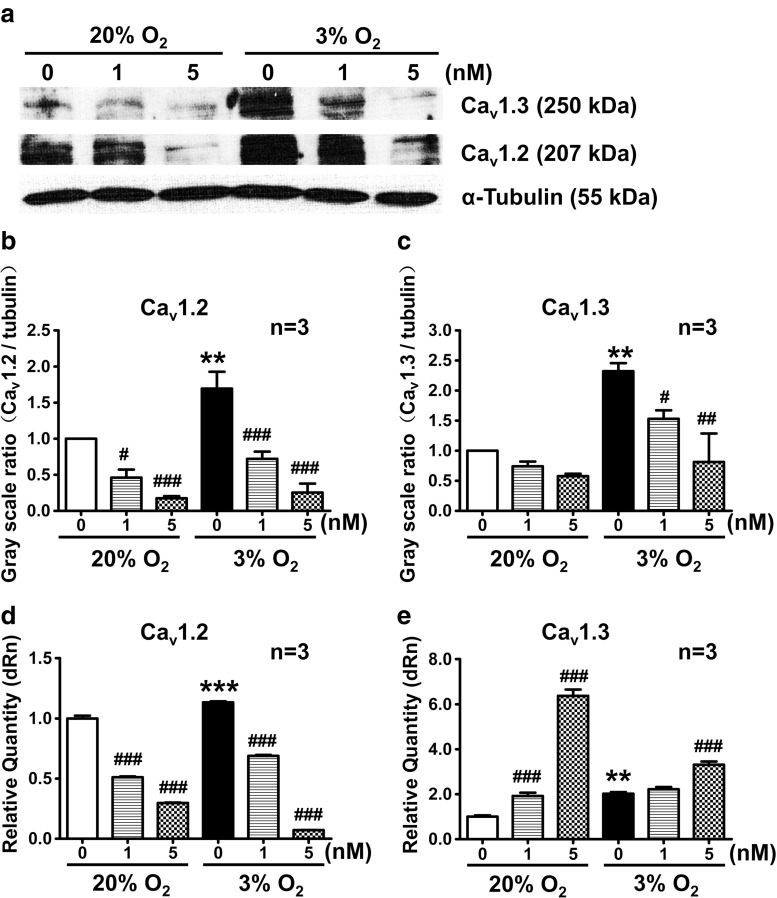
The protein and mRNA expression of Cav1.2 and Cav1.3 during 20 and 3 % O2 was detected by Western blot and real-time PCR. Cav1.2 and Cav1.3 protein expression in PC12 cells was increased in 3 % O2 compared with that in 20 % O2, and decreased in both 3 and 20 % O2 after treatment with echinomycin for 24 h. The mRNA expression of Cav1.2 and Cav1.3 was increased in 3 % O2 compared with 20 % O2. However, when PC12 cells were treated by echinomycin, the mRNA expression of Cav1.2 decreased while the mRNA expression of Cav1.3 increased dose dependently. **P < 0.01 vs 20 % O2; ***P < 0.001 vs 20 % O2; # P < 0.05 vs 20 or 3 % O2; ## P < 0.01 vs 3 % O2; ### P < 0.001 vs 20 or 3 % O2; “n” indicates the number of independent experiments

