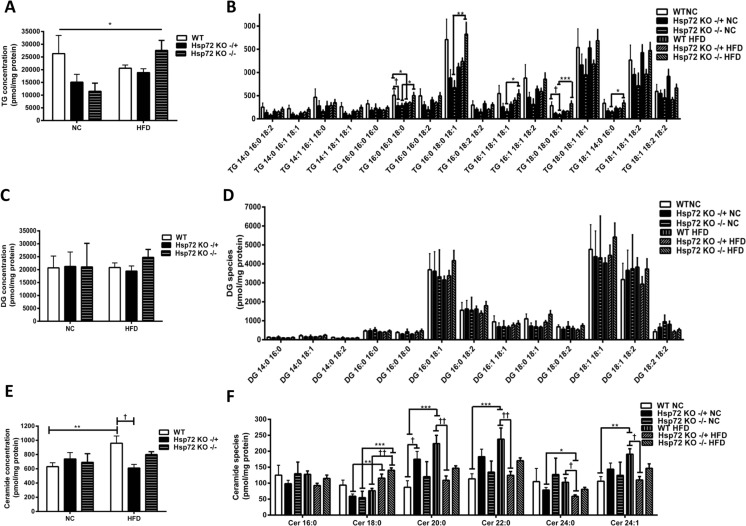
Fig. 8.
Cardiac lipidomic analysis of triacylglycerol (TG), diacylglycerol (DG), and ceramide lipids in Hsp72 KO NC or HFD mice. Mice were fed a NC or high-fat diet for 12 weeks from 8 weeks of age. a Total TG levels and b individual cardiac TG molecular lipid species. c Total DG levels and d individual cardiac DG molecular lipid species. e Total ceramide levels and f individual cardiac ceramide molecular lipid species. n = 4–6 per group. *p < 0.05, **p < 0.01, ***p < 0.001 for dietary effect; † p < 0.05, †† p < 0.01 for genotype effect. All data are presented as mean ± SEM

