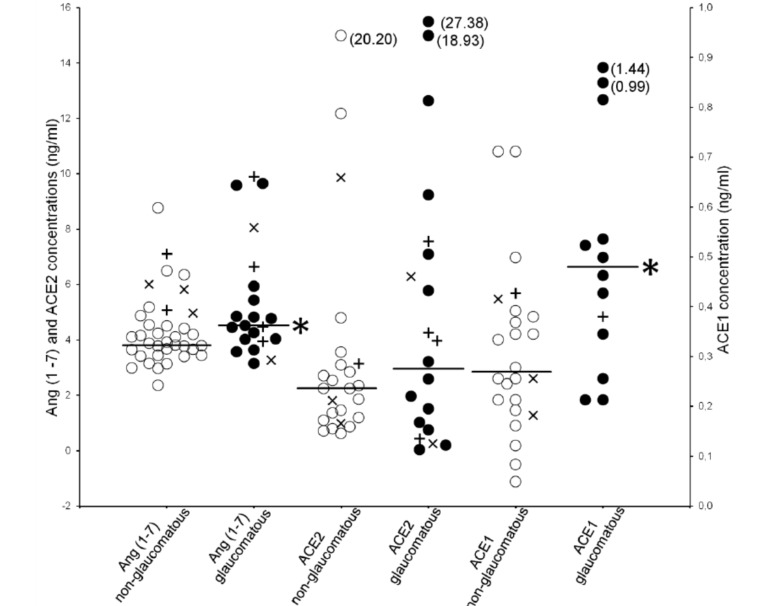
Fig. (1).
Individual aqueous humor concentrations of Ang(1-7), ACE2 and ACE1 in non-glaucomatous (white open circles) and glaucomatous (black spots) patients. Comparison with Mann-Whitney test, *p<0.05. Patients using ACE inhibitors (plus marks) or ATreceptor blockers (x marks) are also shown; these patients were excluded from the data in determination of the median concentrations (horizontal lines). For abbreviations see Table 1.

