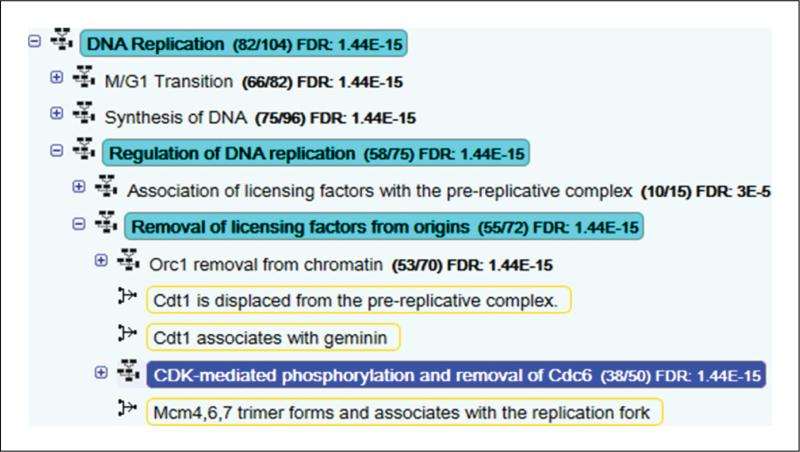
Figure 6.
Detail of the Pathway Hierarchy showing analysis results. The pathway CDK-mediated phosphorylation and removal of Cdc6 is selected (highlighted in dark blue). The ‘parents’ of this pathway representing higher levels in the hierarchical organisation are highlighted in pale blue. Over-representation analysis results are to the right of the pathway name. Pathway topology results are indicated by orange boxes around matching reaction names.

