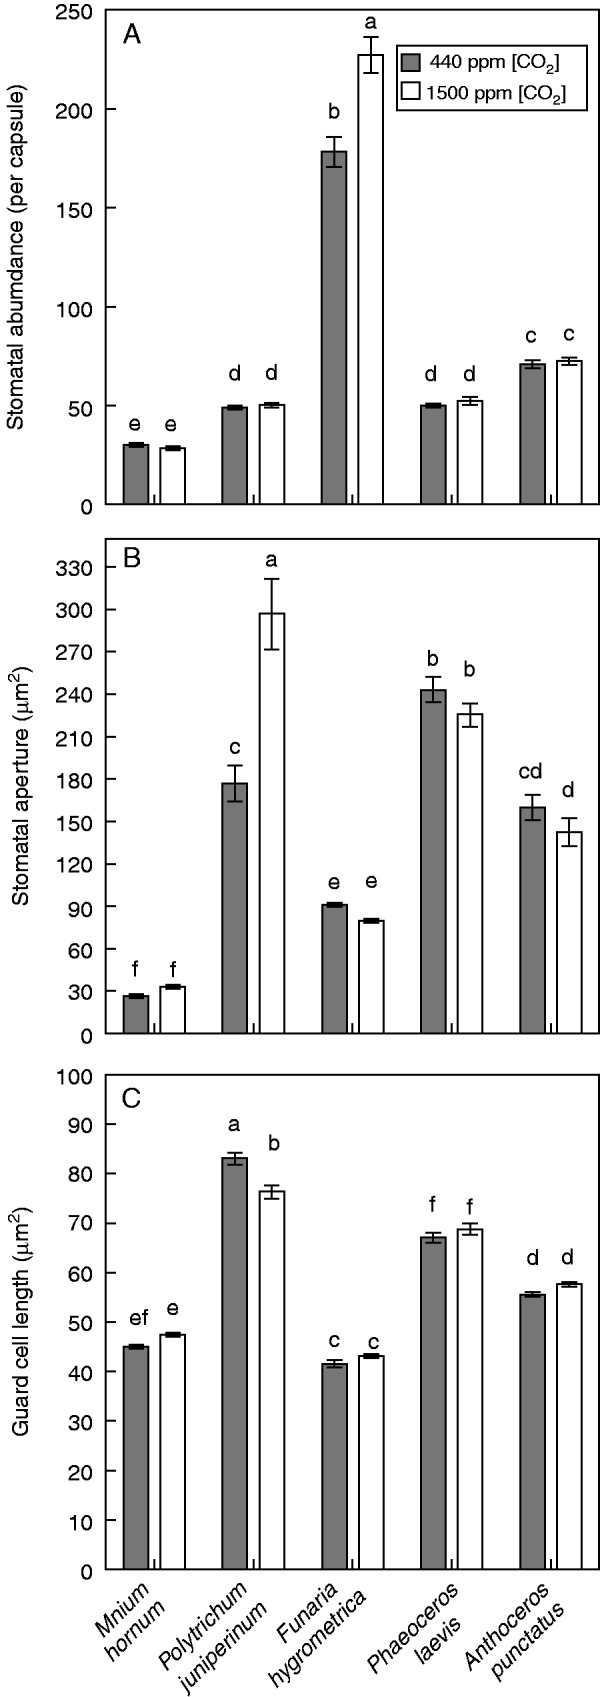
Fig. 2.

(A) Stomatal abundance on sporophyte generations of plants grown under 440 p.p.m. [CO2] (grey bars) and a replicated Palaeozoic [CO2] of 1500 p.p.m. (white bars). Error bars show ±1 s.e.; different letters denote statistical significance where P < 0·05 (ANOVA, post hoc Tukey test), n = 50 (M. hornum), 50 (P. juniperinum), 15 (F. hygrometrica), 50 (P. laevis), 30 (A. punctatus). (B) Mean aperture of stomatal pores on five individual sporophytes of each non-vascular species studied. Sporophytes had all undergone complete development at 440 p.p.m. [CO2] (grey bars) or 1500 p.p.m. [CO2] (white bars). Error bars show ±1 s.e., n = 5. Different letters indicate where P < 0·05 (ANOVA, post hoc Tukey test). (C) Mean length of guard cells measured on five individual sporophytes of each species of bryophyte.
