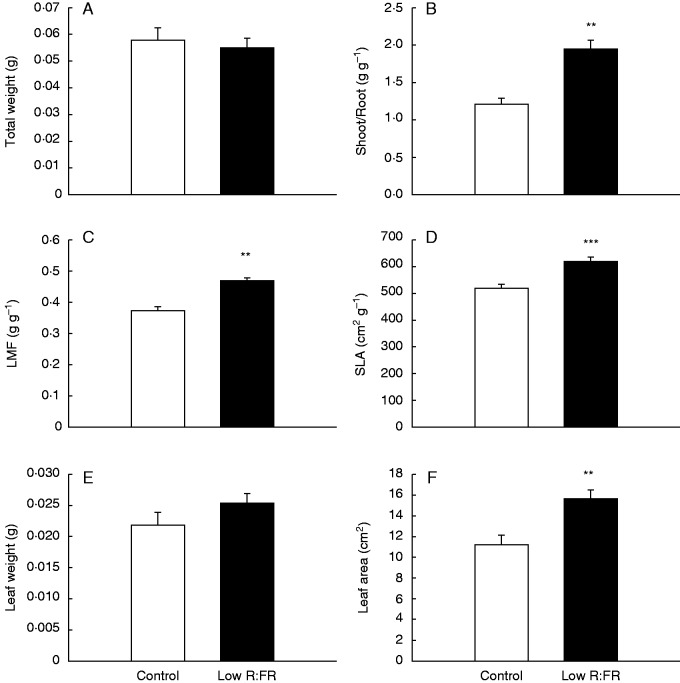
Fig. 2.
Growth response of ‘Alva’ plants after 10 d exposure to low R:FR conditions (low R:FR, n = 18) or under control light conditions (control, n = 19). In (C), leaf mass fraction (LMF; g leaf g–1 plant) is shown. (D) Specific leaf area (SLA; cm2 leaf g–1 leaf). Bars represent means ± s.e. Data were analysed with a Student’s t-test. Significant differences are indicated by *P < 0·05, **P < 0·01 or ***P < 0·001.

