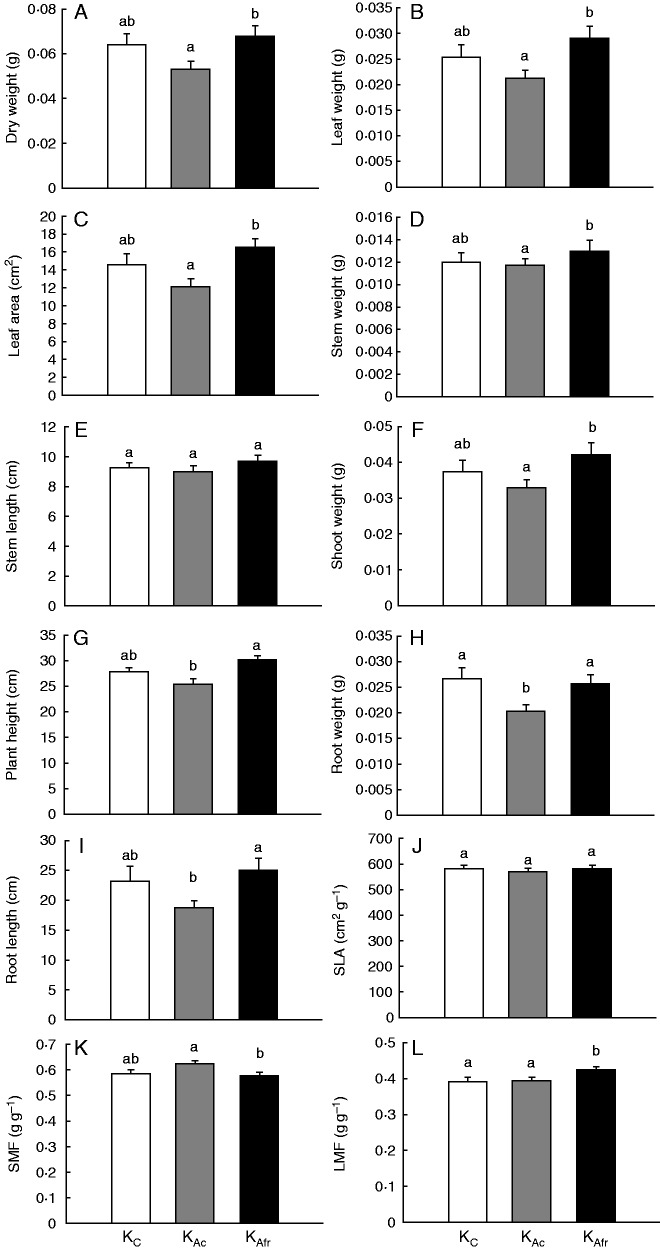
Fig. 6.
Growth parameters of unexposed ‘Kara’ plants (C), ‘Kara’ exposed to control ‘Alva’ VOCs (KAc) and to VOCs of low R:FR-grown ‘Alva’ (KAfr). Means and s.e. are shown (n = 15–19). (J) Specific leaf area (cm2 leaf g–1 leaf). (K and L) Shoot and leaf mass fraction (SMF and LMF, respectively, g leaf g–1 plant). Significant differences are represented by different letters (P < 0·05, one-way ANOVA, Bonferroni-post-hoc).

