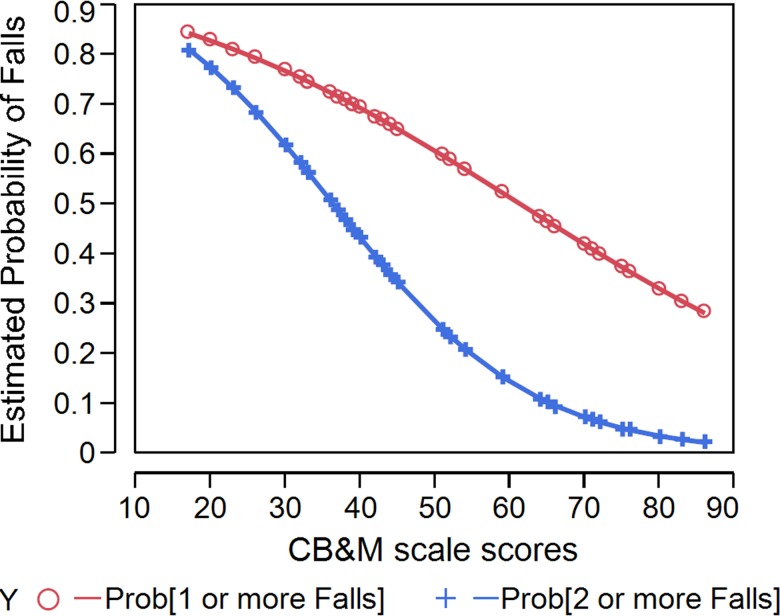
Figure 1.
Logistic predictions of the faller (≥1 falls) and recurrent faller (≥2 falls) models in the past year, using the CB&M scale as the predictor assessment. In both models, the probability of falling decreases as CB&M scale scores increase; the slope of the prediction is better for the recurrent fallers.
CB&M=Community Balance and Mobility Scale.

