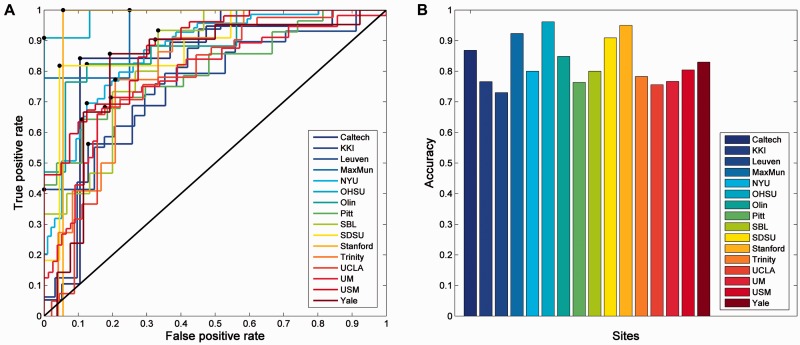
Figure 4.
Classification of individuals as autistic versus controls using the voxel-based region of interest-wise functional connectivity measures identified. (A) Receiver operating characteristic (ROC) curves showing the true positive rate plotted against the false positive rate are provided for each of the centres that contributed subjects to the database. (B) Accuracy (percentage correct) classification of a subject as autistic or in the control group for the data from each of the centres.

