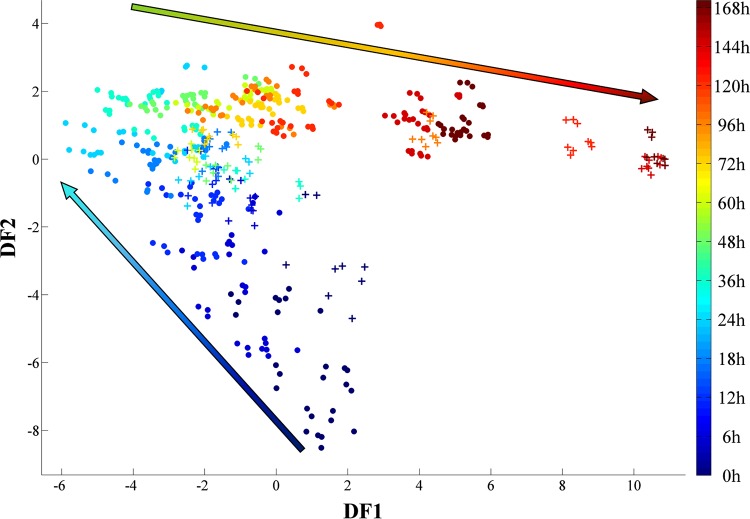
FIG 2.
PC-DFA score plot of the FTIR data collected for all the samples. Five PCs with a total explained variance of 97.39% were used for the DFA. The two sets of samples, i.e., the 100-ml serum bottles (circles) and the bioreactor (crosses), displayed similar growth patterns. However, compared to cells grown in the serum bottles, the bioreactor-grown cells displayed an extended lag phase (up to ∼24 h) and consequently entered the stationary phase at a later time point. The arrows illustrate the main trajectories with respect to time. The color bar on the right represents the duration of the incubation during which samples were collected.

