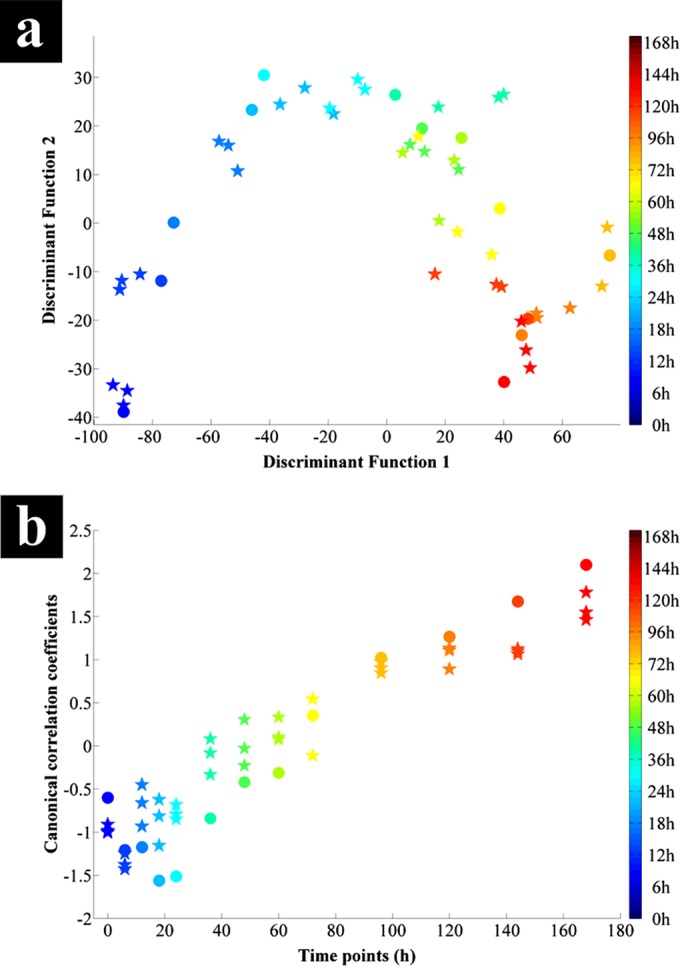
FIG 4.

(a) PC-DFA score plot of the G. sulfurreducens cell extracts analyzed using GC-MS from 100-ml serum bottles (stars) and a 5-liter bioreactor (circles), collected from all time points. (b) CCA plot against time of the relative peak areas of detected metabolites by GC-MS for 100-ml serum bottle (stars) and bioreactor (circles) samples. Both samples displayed an overall linear time-dependent correlation. The color bars on the right represent the duration of the incubation during which samples were collected.
