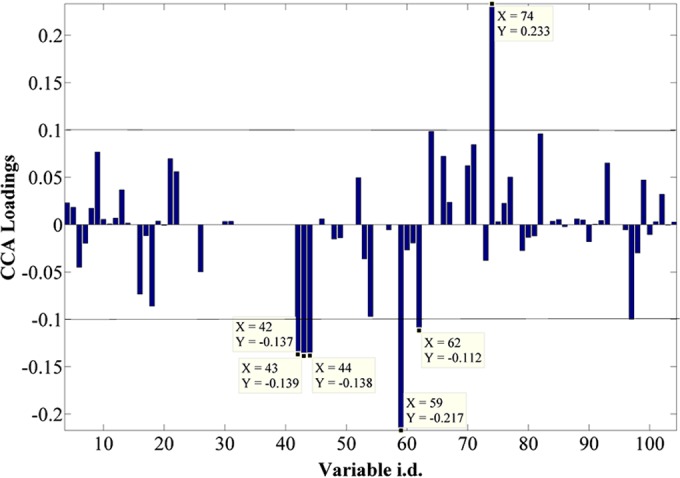
FIG 5.

CCA loading plot of all the sample extracts analyzed by GC-MS, showing the most significant metabolites contributing toward the positive and negative correlation with time throughout the data set. The list of identified metabolites can be found in Table S2 in the supplemental material. Fumarate is seen as three peaks, as different derivatization products are seen in GC-MS.
