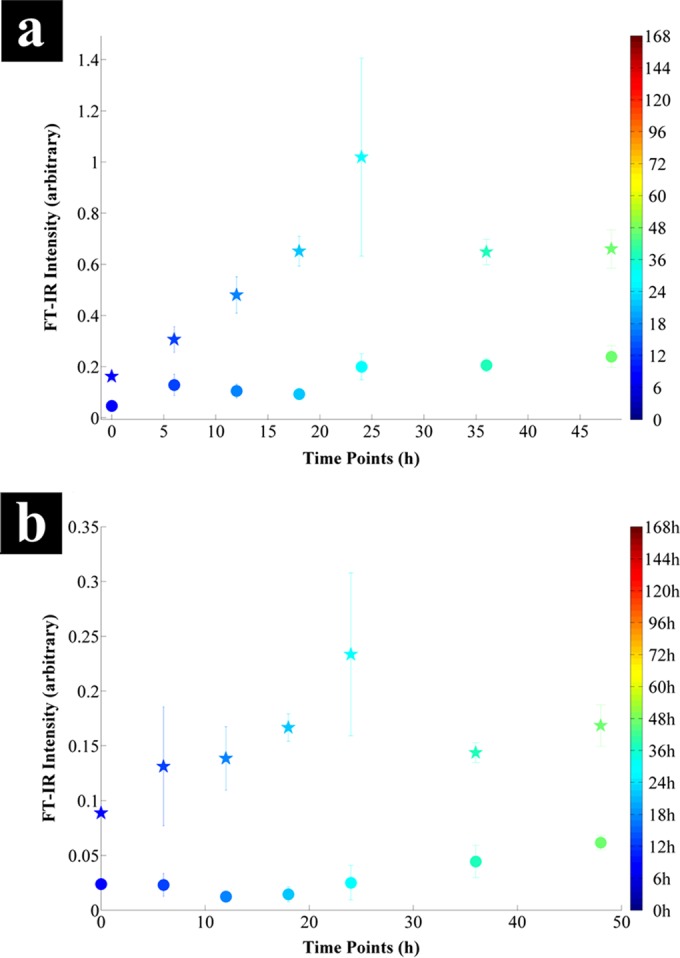
FIG 8.

Comparison of the intensities of significant FTIR vibrations identified by the PC-DFA loading plot of serum bottle (stars) and bioreactor (circles) samples during the first 48 h of incubation (see Fig. S2 in the supplemental material). (a) The 1,655 cm−1 amide I region due to stretching of C=O bonds; (b) the 1,402 cm−1 region due to symmetric stretching of C=O bonds in carboxylic acids. Data points represent the mean of the three replicates, with bars indicating the relative standard deviation. The color bars on the right represent the duration of the incubation during which samples were collected.
