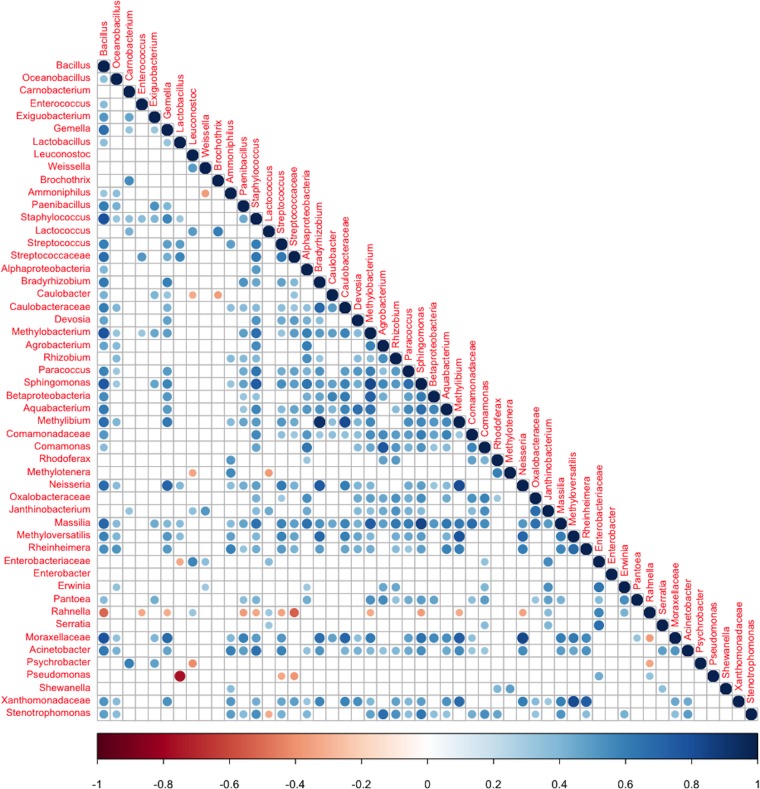
FIG 6.
Significant co-occurrence and coexclusion relationships between bacterial OTUs. Spearman's rank correlation matrix of OTUs with an abundance of ≥0.1% in at least 5 samples. Only phylotypes assigned to the phyla Proteobacteria and Firmicutes were considered. Strong correlations are indicated by large circles, whereas weak correlations are indicated by small circles. The colors of the scale bar denote the nature of the correlation, with 1 indicating a perfectly positive correlation (dark blue) and −1 indicating a perfectly negative correlation (dark red) between two phylotypes. Only significant correlations (FDR < 0.05) are shown.

