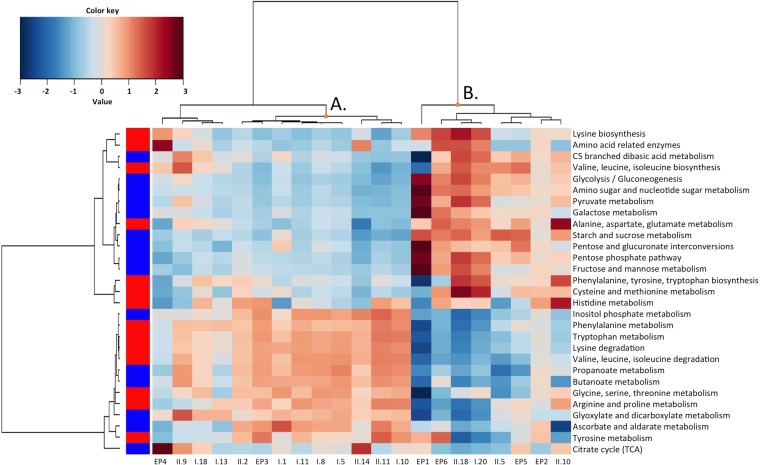
FIG 7.
Heat plot of the abundances of genes presumptively belonging to carbohydrate (blue squares) and amino acid (red squares) metabolism pathways in the ingredients and end products. A hierarchical Ward linkage based on the Spearman correlation coefficients was used for the clustering. TCA, tricarboxylic acid.

