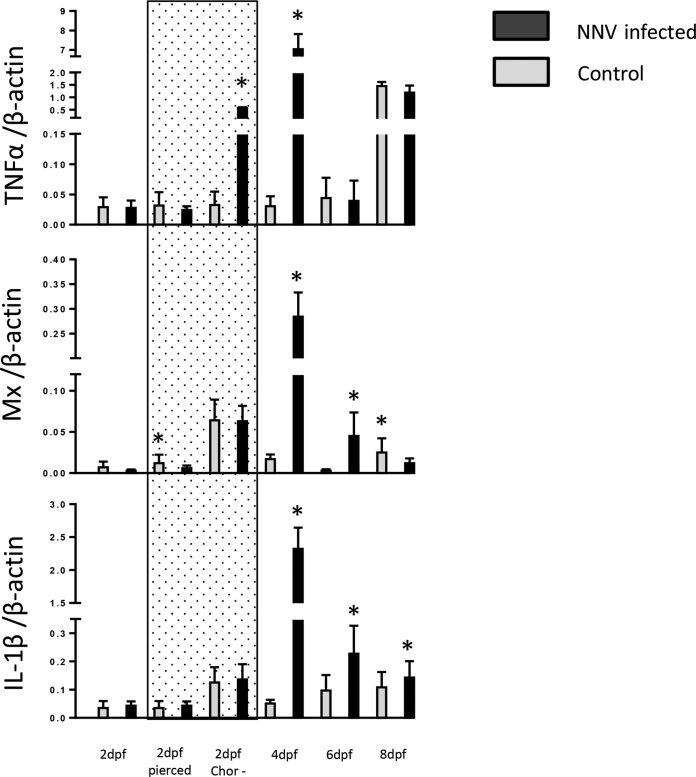
FIG 6.
Temporal expression levels of genes for TNF-α, Mx, and IL-1β following NNV infection at different days postfertilization. RNA was extracted from a pool of five larvae taken from each group at 24 h postinfection. cDNA was used to quantify innate immune gene expression by real-time RT-PCR. Each bar represents the mean ± SE of triplicate readings from three independent experiments. Gene expression levels were normalized against the β-actin expression level. dpf, days postfertilization; 2dpf pierced, eggs were pierced with a needle before infection; 2dpf Chor−, eggs were manually dechorionated before infection. The area marked with shading represents results for larvae that underwent piercing and dechorionation at 2 dpf. Statistically significant differences are marked with asterisks.

