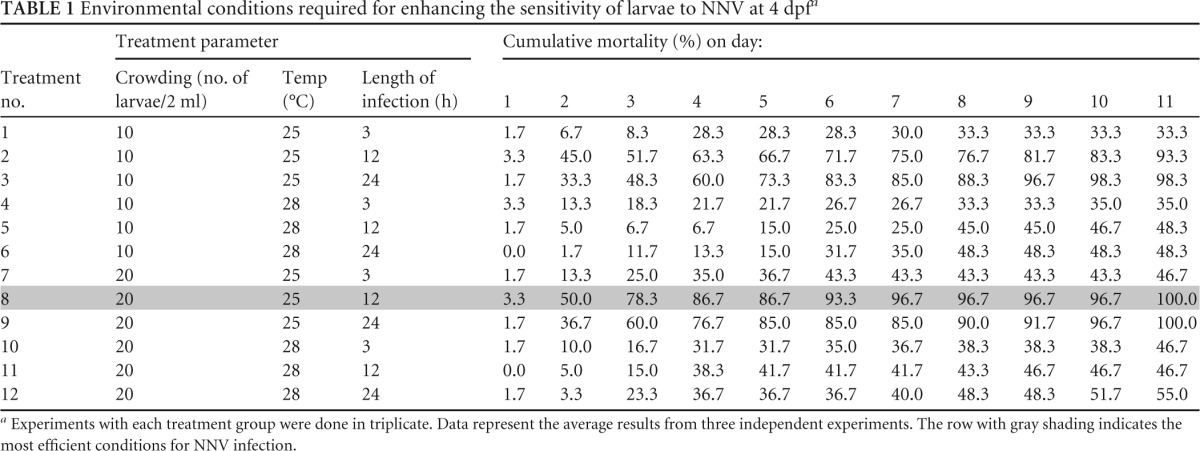
TABLE 1.
Environmental conditions required for enhancing the sensitivity of larvae to NNV at 4 dpfa

Experiments with each treatment group were done in triplicate. Data represent the average results from three independent experiments. The row with gray shading indicates the most efficient conditions for NNV infection.
