
FIG 4.
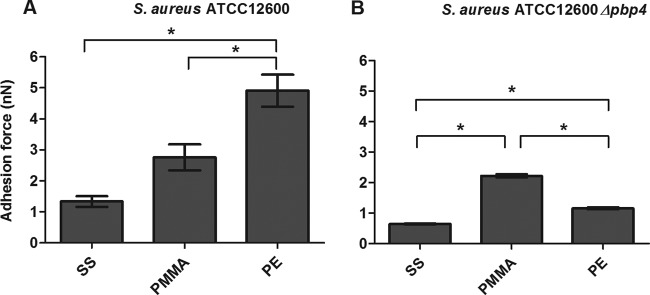
Forces of S. aureus adhesion to different biomaterials. The forces of S. aureus ATCC 12600 (A) and S. aureus ATCC 12600 Δpbp4 (B) adhesion to SS, PMMA, and PE are shown. Each bar represents the average of 135 adhesion force curves measured with 9 different bacterial probes taken from three separately grown staphylococcal cultures. Error bars represent the standard errors of the means. *, significant differences (P < 0.05) in forces of staphylococcal adhesion to different biomaterials (two-tailed, two-sample equal variance Student's t test).