
FIG 7.
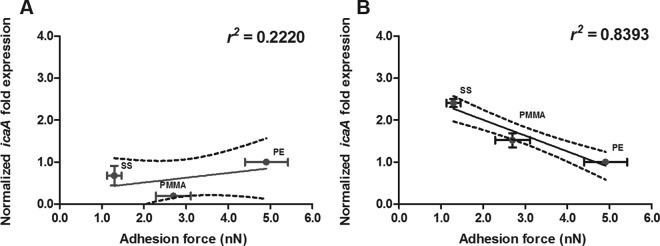
icaA gene expression versus adhesion forces in 1-h and 3-h-old biofilms of S. aureus ATCC 12600. Normalized icaA expression in 1-h-old (A) and 3-h-old (B) S. aureus biofilms is shown as a function of the adhesion force. Linear regression analysis was performed to analyze the correlation between icaA gene expression and adhesion force. The solid lines represent the best fit to a linear function, while r2 values represent the correlation coefficients. The dotted lines enclose the 95% confidence intervals. The level of icaA expression was normalized to that of gyrB expression and is presented as the normalized fold expression with respect to the results for PE. Each point represents the average ± standard error of the mean from three individual experiments with separately grown staphylococcal cultures.