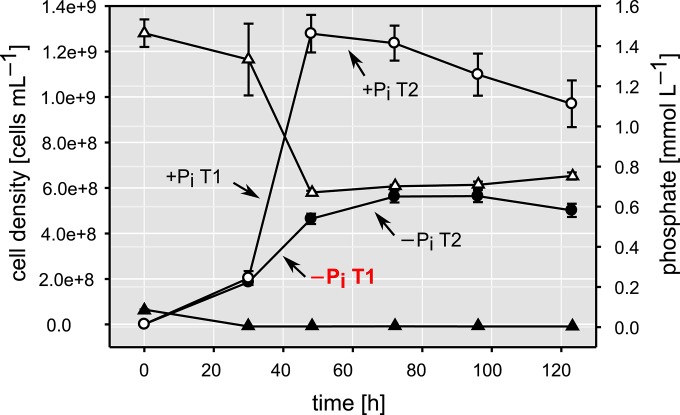
FIG 1.
Graph showing cell densities (circles) and phosphate concentrations (triangles) over time for cultures grown under +Pi (empty symbols) and −Pi (filled symbols) conditions. Error bars represent the standard deviations of data from biological triplicates. The arrows indicate the growth stages where samples for the proteomic analyses were taken. For all proteome samples, −Pi T1 (shown in red) was used as a reference.

