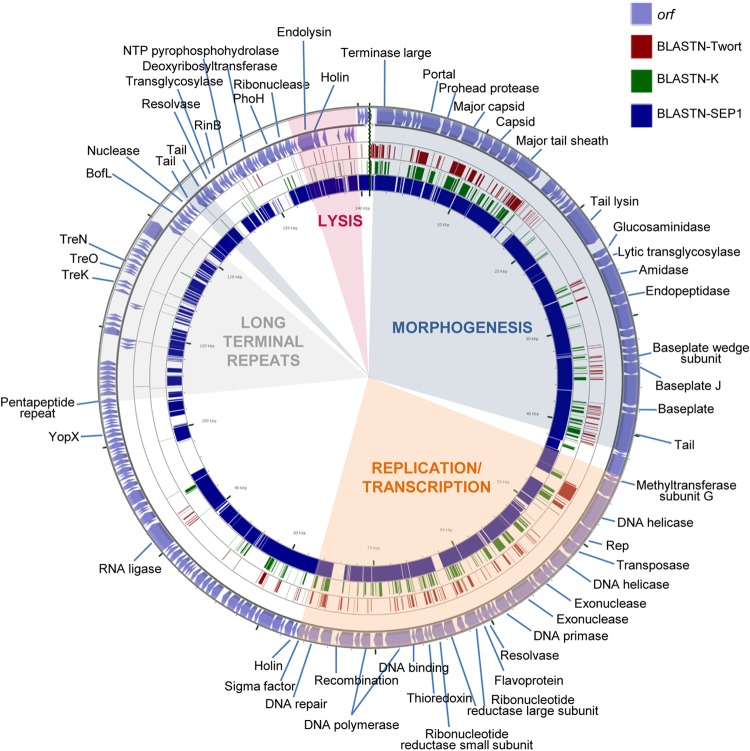
FIG 3.
Genome organization of phage phiIPLA-C1C and BLASTN comparisons. The outer ring with arrows represents the ORFs of the circularized phage. The predicted gene functions are indicated. The different functional modules in the genome are shown by colored shading. BLASTn analysis, whose results are represented by each inner ring, was performed with the representative phages Twort (dark red), K (green), and (most similar) phiIBB-SEP1 (blue).

