
Figure 1.
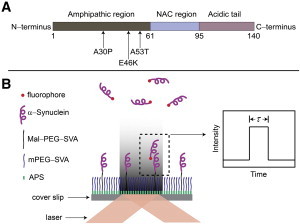
(A) Schematic of the structure of α-Syn. The amphipathic region (1–61), nonamyloid component region (NAC, 61–95), and acidic tail (95–140) are colored dark gray, light blue, and light pink, respectively. Arrows indicate the three single-point mutations, A30P, E46K, and A53T. A cysteine is tagged at the C-terminus for single cysteinyl α-Syn. Two cysteines are placed at both ends for double cysteinyl α-Syn. (B) Schematic of the TIRF setup. A glass coverslip is functionalized with APS, followed by functionalization with two types of PEG and immobilization of the unlabeled α-Syn. The solution of the labeled α-Syn (shown with red dots at one end) is injected into the sample chamber, allowing free α-Syn molecules to interact with the tethered protein molecules. A laser is brought to the sample in the total internal reflection mode, enabling the generation of an evanescent field and excitation of molecules in the proximity of the surface. The dimerization event is detected by the appearance of a fluorescence burst with duration τ defining the dimer lifetime, as shown schematically (inset). To see this figure in color, go online.