
Figure 2.
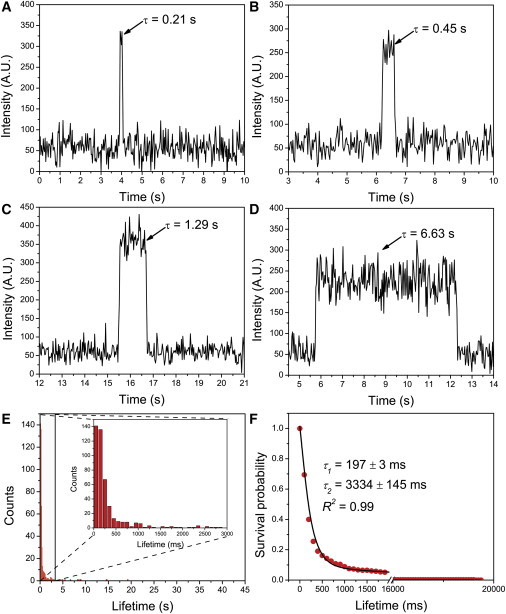
Typical fluorescence time traces of WT α-Syn dimer with various lifetimes. Bursts of fluorescence (arrows) represent the formation of dimers by binding of a fluorophore-labeled α-Syn to an immobilized α-Syn on the surface with various lifetimes: 0.21 s (A), 0.45 s (B), 1.29 s (C), and 6.63 s (D). The concentrations of labeled α-Syn in solution and unlabeled α-Syn functionalized on the PEG-ylated surface are 1 nM and 25 pM, respectively. (E) Quantitative analysis of the fluorescence data. Histogram of lifetimes of WT α-Syn dimer (n = 462). The majority of fluorescence bursts are shown in the inset of Fig. 2E. (F) Normalized survival probability graph in which the red circles are normalized data points and the solid line is a fitting curve approximated by a two-exponential decay equation with lifetimes indicated in the graph. The errors are fitting errors. The R-squared value indicates the goodness of the fit. To see this figure in color, go online.