
Figure 3.
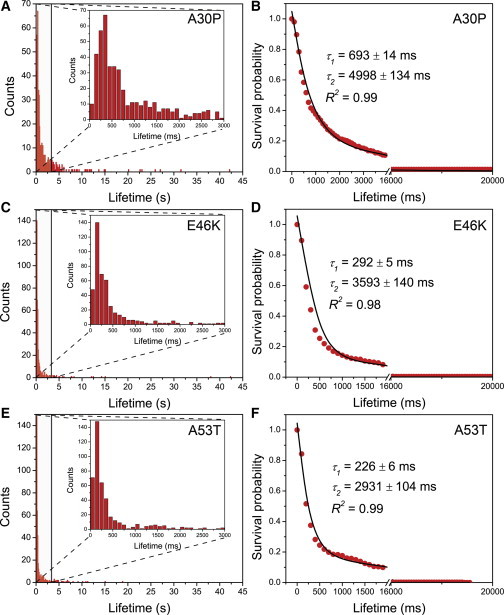
Quantitative analysis of the experiments with α-Syn mutants A30P (A and B, n = 505), E46K (C and D, n = 460), and A53T (E and F, n = 453). The concentrations of labeled α-Syn in solution and unlabeled α-Syn functionalized on the PEG-ylated surface are 1 nM and 25 pM, respectively. (Insets in A, C, and E) Zooms of the graphs, showing the majority of the fluorescence bursts spanning 0–3 s. For each mutant dimer, the corresponding normalized survival probability is plotted against the lifetime and fitted with a two-exponential decay equation (B, D, and F). Red circles are normalized data points, solid lines are fitting curves, and lifetimes are shown in the graphs. The errors are fitting errors. R-squared values indicate the goodness of the fit. To see this figure in color, go online.