
Figure 5.
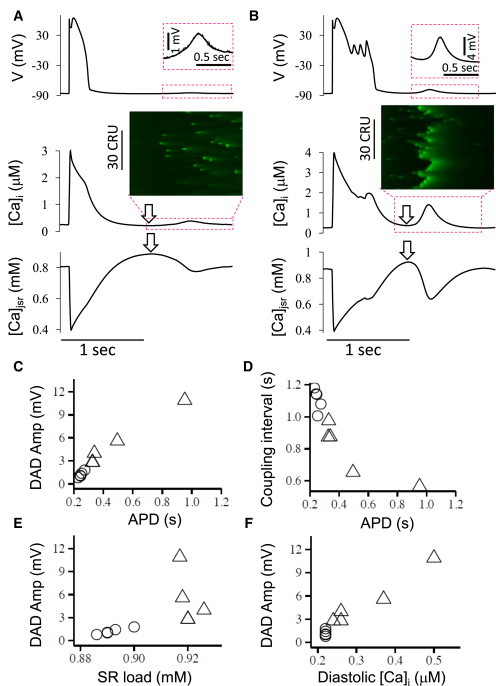
Modulation of DADs by APD. (A) Voltage, [Ca]i, and [Ca]jSR versus time showing a regular AP followed by a small DAD. (B) Same as (A) but for a long AP with EADs followed by large DAD. (Insets) Line scans of [Ca]i during the DAD periods. (C–F) Plots of DAD amplitude versus APD (C), SR load (E), diastolic [Ca]i (F), and coupling interval versus APD (D) for DADs after APs of varying duration without (circles) or with (triangles) EADs. The definitions of SR load and diastolic [Ca]i (arrows) are indicated in (A) and (B). The coupling interval was defined as the interval from the end of the AP to the peak of the DAD. The parameters are the same as in Fig. 1A, but under Ca overload ([Ca]o = 5 mM) with [Na]i = 10 mM and 1 mV left-shift in actss of ICa,L. The control IKs was used in (B) but was increased by a factor of 1.6 to shorten APD in (A). To see this figure in color, go online.