
Figure 9.
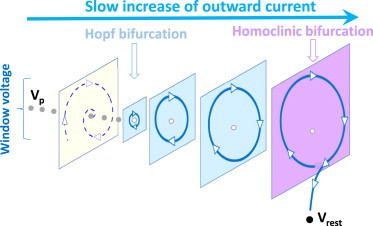
Schematic diagrams for the mechanisms of EADs. Schematic diagram showing the bifurcations for EADs. The value Vp is the quasi-equilibrium steady-state voltage in the plateau, and Vrest is the resting potential. To see this figure in color, go online.