
Figure 3.
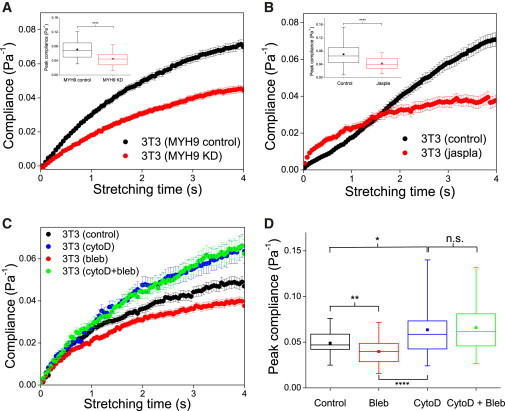
Role of actin cortex in compliance of 3T3 fibroblasts brought into suspension. (A) Compliance curves for 3T3 fibroblasts with RNAi against MYH9 (n = 114), compared to controls (n = 95). (B) Compliance curves for 3T3 fibroblasts after treatment with Jasplakinolide (n = 38), compared to controls (n = 78). (Insets in A and B) Box plots of peak compliance for control versus knockdown or drug treatments. (C) Compliance curves for 3T3 fibroblasts after treatment with cytochalasin D only (n = 45), cytochalasin D plus blebbistatin (n = 38), or with blebbistatin only (n = 80), compared to controls (n = 60). All experiments were performed on cells of the same passage on the same day. (D) Box plots of the peak compliance for cells under various treatments as in (C). ∗∗∗∗p < 0.0001, ∗∗p < 0.01 and ∗p < 0.05. To see this figure in color, go online.