
Figure 4.
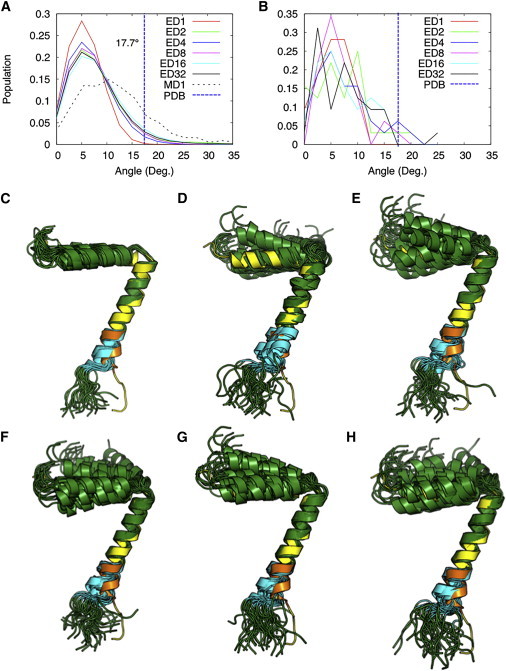
(A and B) Distributions of the angles between the principal axes of two transmembrane helical segments Y21–A35 and G38–F45 in all structures from simulations (A) and the top 32 structures with the least NMR violations (B). (C–H) The top 32 structures (green) are aligned to PDB:1MZT (yellow) with respect to Y21–T36 in systems ED1 (C), ED2 (D), ED4 (E), ED8 (F), ED16 (G), and ED32 (H). The G38–F45 region is highlighted in orange in PDB:1MZT and in cyan in the top 32 structures. To see this figure in color, go online.