
Figure 5.
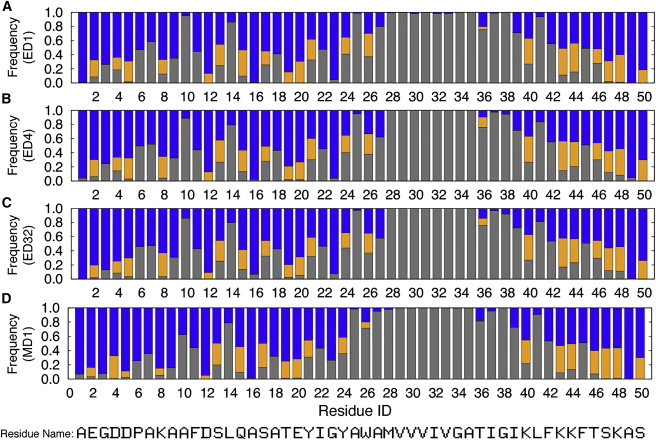
Interactions between each residue and solvent components. The graph shows the frequency with which each atom or more atoms of a specific residue is found within 4 Å of a lipid hydrocarbon site (gray), lipid headgroup site (orange), or water molecule (blue), in system ED1 (A), ED4 (B), ED32 (C), and MD1 (D). See Fig. S3 for all ED systems. To see this figure in color, go online.