
Figure 6.
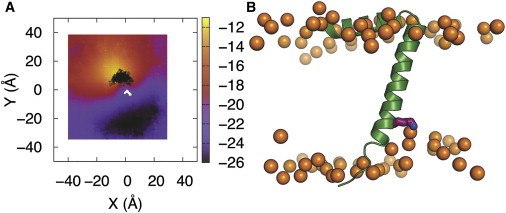
(A) Average z coordinates of lipid phosphorus atoms in the lower bilayer leaflet of system ED32. The bilayer center was aligned to z = 0 and then protein from each snapshot was aligned via translation on the xy plane. The z coordinate values of phosphorus atoms in the lower leaflet are presented in gradient color (purple, red, and yellow). The black area shows where the K40 charged side chain is positioned during the simulations. (B) One snapshot from ED32 showing the interactions between lipids and K40 (phosphorus atoms in orange, K40 in purple stick, and protein in green cartoon). To see this figure in color, go online.