
Figure 7.
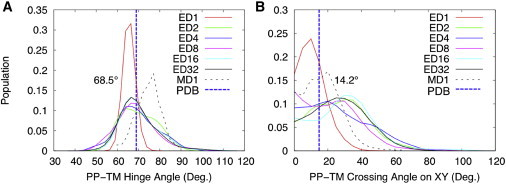
Distributions of the (hinge) angles between the principal axes of the periplasmic and transmembrane helices (A) and the (crossing) angles between their principal axes projected on the xy plane (B). To see this figure in color, go online.
Official websites use .gov
A
.gov website belongs to an official
government organization in the United States.
Secure .gov websites use HTTPS
A lock (
) or https:// means you've safely
connected to the .gov website. Share sensitive
information only on official, secure websites.
Distributions of the (hinge) angles between the principal axes of the periplasmic and transmembrane helices (A) and the (crossing) angles between their principal axes projected on the xy plane (B). To see this figure in color, go online.