
Figure 1.
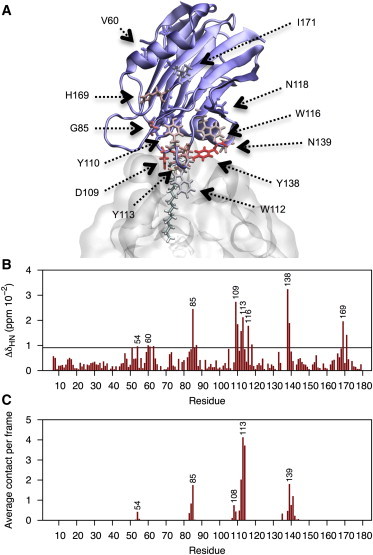
(A) Initial configuration of the EqtII-DPC54 complex before MD simulation. The single DPC molecule represented with bonds was restrained at the POC headgroup over the initial 20 ns of equilibration. Residues heavily affected in NMR experiments are represented in bonds and color-coded (blue-red) according to their CSPs. (B) Normalized perturbations for backbone 1H15N crosspeaks in the presence of 1.5 mM DPC. Dashed line specifies significance where values are greater than the mean plus the standard deviation. Side-chain perturbations are not plotted. (C) Number of intermolecular contacts (<5 Å) experienced between backbone nitrogen positions and heavy atoms of DPC over the last 200 ns of simulation. To see this figure in color, go online.