
Figure 2.
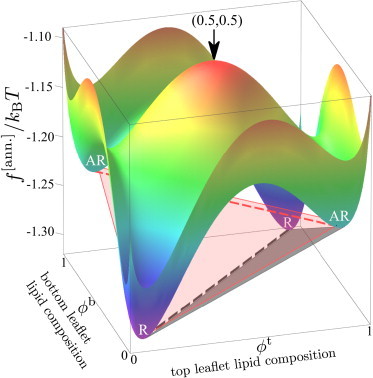
Local free-energy landscape for the parameter point indicated by the green dot in Fig. 5c. The AR-AR and R-R central tie-lines (dashed lines) of Fig. 3 are superimposed, along with two illustrative tangent planes corresponding to three-phase triangles (equilibrium R-R-AR (black shading) and metastable AR-AR-R (red shading)). To see this figure in color, go online.