
Figure 1.
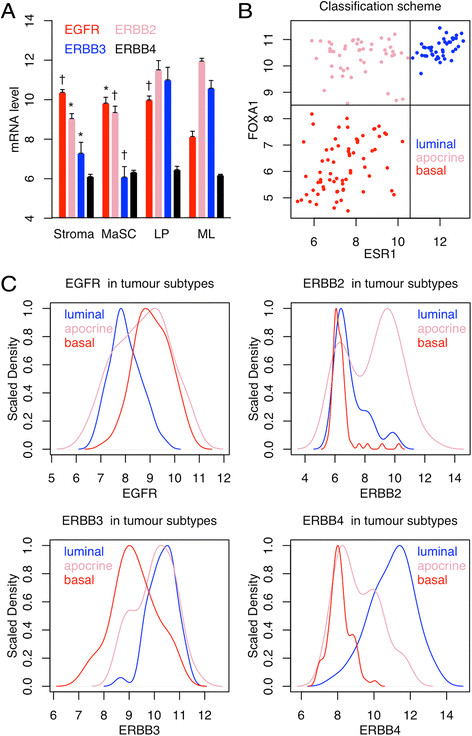
EGFR family gene expression in normal and tumor cells. A. Illumina gene expression data from normal human reduction mammoplasty cells (mean + SEM). MaSC, mammary stem cell; LP, luminal progenitor; ML, mature luminal. Error bars sem; † p < 0.01; * p < 0.05; n = 3; the p values are for comparisons of ML with the other groups. B&C. Affymetrix gene expression data for large operable or locally advanced breast cancer. The scatterplot in B shows how the tumors were classified into luminal (ER+/FOXA1+, 43 samples); molecular apocrine (ER-/FOXA1+, 49 samples); and basal-like (ER-/FOXA1-, 69 samples). The plots in C show the expression profile of EGFR family members in each tumor class. The distributions are strikingly bimodal (see text for details). The maximum density for each distribution is scaled to 1 to facilitate comparison of the different tumor classes.