
Figure 11.
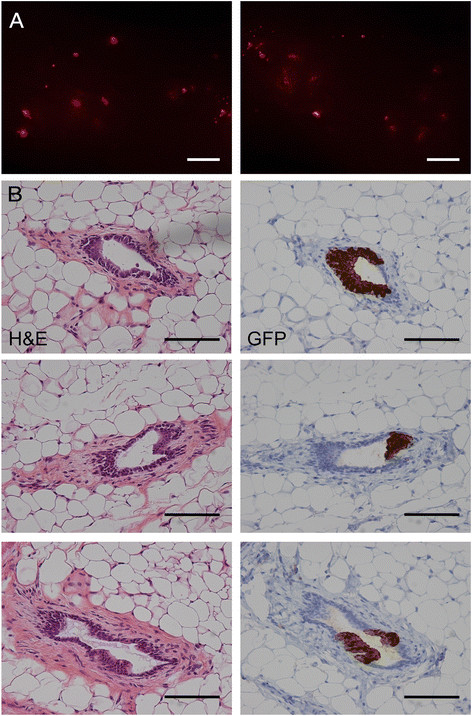
Foci of engrafted human cells 3 weeks after intraductal injection of 4G-shp53 cells. A. Stereomicrograph showing isolated foci of human cells (the images cover a single gland with a small overlap in the middle). B. Attachment of 4G-shp53 cells to the duct wall 3 weeks after intraductal injection. Left panels, H&E staining. Right panels, matched sections showing GFP staining to identify the human cells. The clumps of human cells correspond to the scattered foci of fluorescent cells seen by stereomicroscopy in A. Scale bars A 1 mm, B 100 μm. n = 2.