
Figure 8.
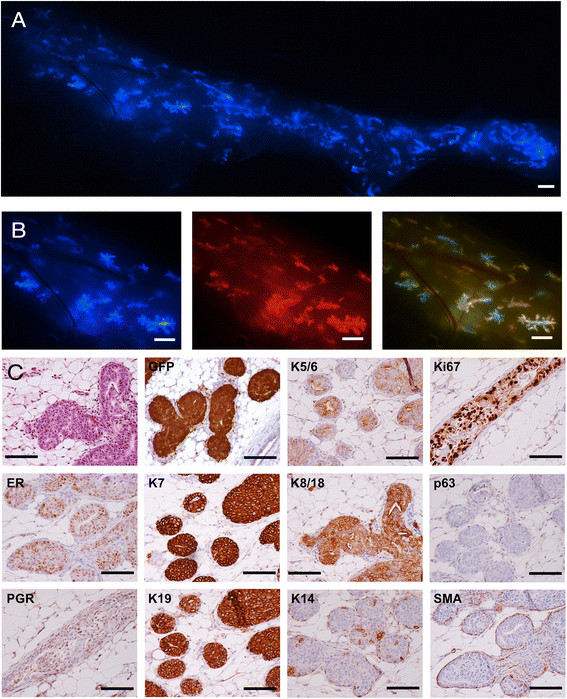
DCIS formation 3 weeks after intraductal injection of 4G-shp53-PI3K tumor cells. A. Composite image showing human cells expressing CFP scattered throughout the gland. B. Enlarged images; the right panel shows alternating clusters of yellow and green cells. C. H&E stain and immunohistochemistry showing ERα+, Ki67+ DCIS (the PGR staining is negative in the tumor cell nuclei relative to controls on the slide). Scale bars A & B 1 mm, C 100 μm.