Figure 2.

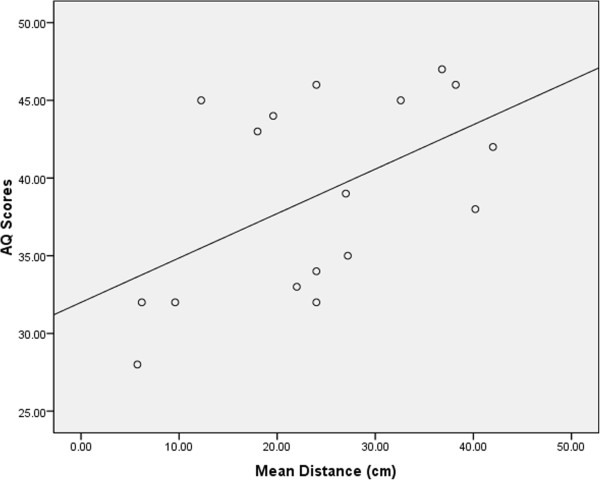
Scatter plot showing the positive correlation between mean distance of odour detection thresholds (cm) and Autism-Spectrum Quotient scores (0 to 50) for the ASC group.

Scatter plot showing the positive correlation between mean distance of odour detection thresholds (cm) and Autism-Spectrum Quotient scores (0 to 50) for the ASC group.