
Figure 1.
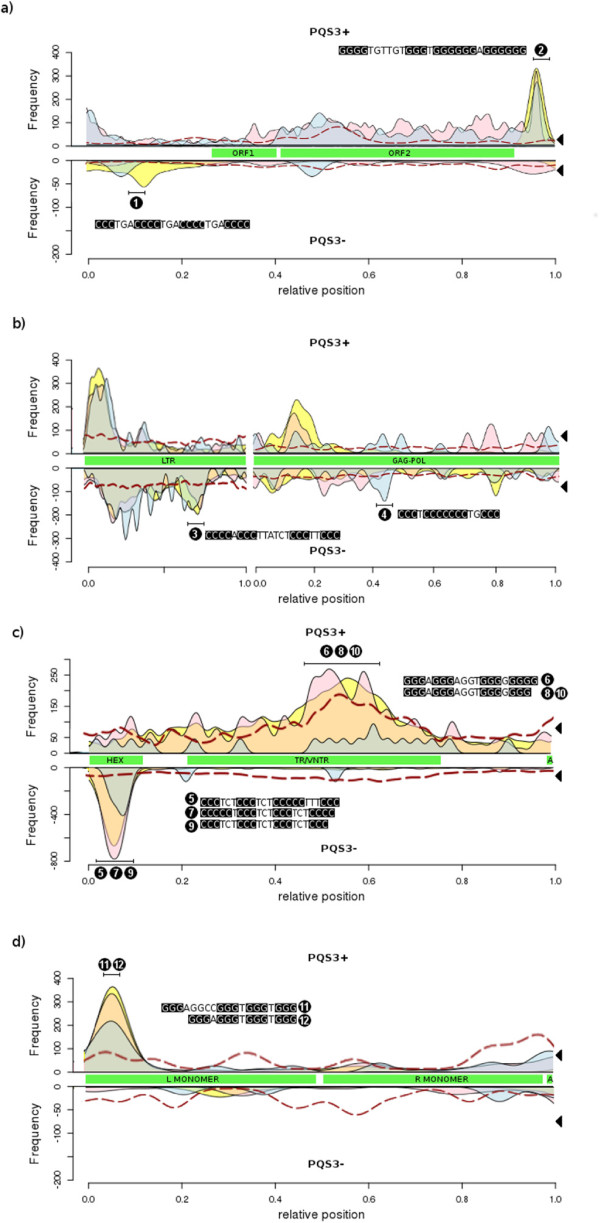
Occurrence of PQSs along human LINE-1 (a), HERV (b), SVA (c) and Alu (d). The density of PQS clusters containing a minimum of four adequately spaced GGG groups in the sense strand (PQS3+, upper lines) and antisense strand (PQS3-, lower lines) visualized along LINE-1 (a), HERV (b), SVA (c) and Alu elements (d). Sliding window covered between 40-120 bp of the element length. Frequency represents the number of PQSs in such window in the entire family. Green boxes show annotation with main structural components from typical full-length elements (ORF - open reading frame, LTR - long terminal repeat, Hex - hexamer tandem repeat with a CCCTCT consensus, TR/VNTR - SVA tandem repeats with a period of approximately 36, A - polyA tail, L and R MONOMER - 7SL RNA-derived monomer). Chromosomes are visualized separately where autosomes are in yellow, X chromosomes in red and Y chromosomes in blue. The dashed red line shows PQS frequency in randomized control sequences generated by an equivalent 2nd-order Markov chain model. The black triangles on the right show reference densities of PQS sites in the entire human genome recalculated into the coordinates of the given family.