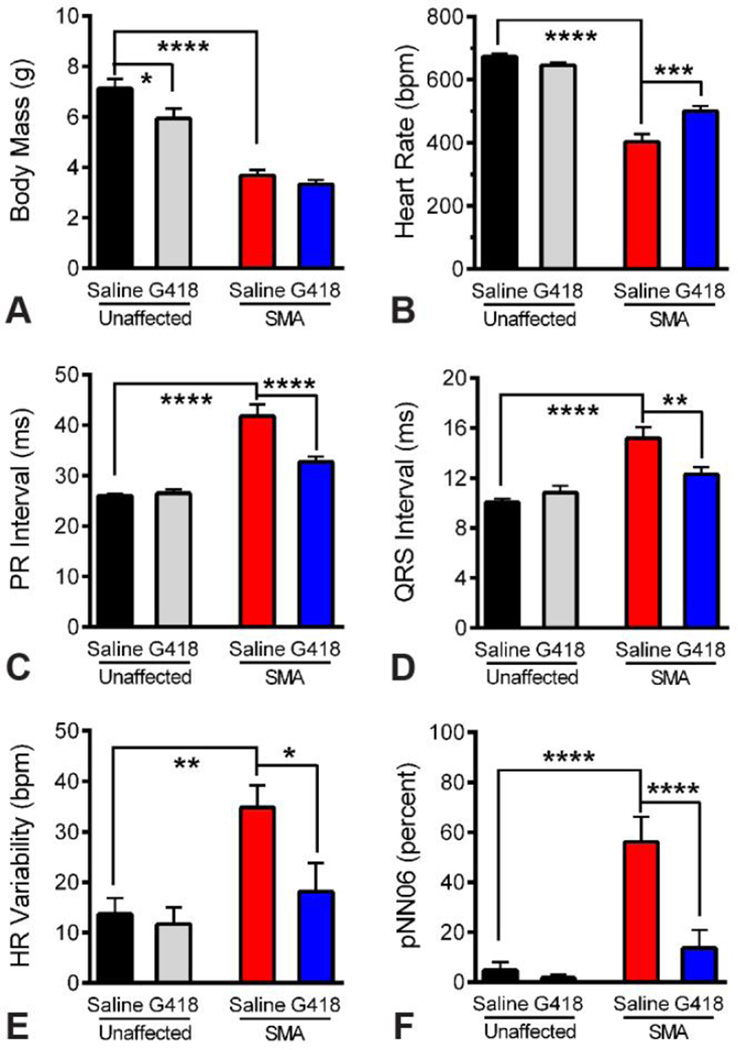
Figure 3.
Quantitative ECG benefits from G418 treatment of SMA mice. A) Body mass of treatment groups at time of ECG analysis on PND11. B) Heart rate of treatment groups, showing SMA bradycardia and effects of drug treatment. C) PR interval, showing heart block in SMA mice and effects of drug treatment. D) QRS interval, showing cardiac conduction deficits in SMA mice and effects of drug treatment. E–F) Measures of heart rate variability, showing alteration of HR Variability (E) and pNN06 (F) in SMA mice and the effects of drug treatment. (n of 10, * P less than 0.0.5, ** P less than 0.0.1, *** P less than 0.0.005, **** P less than 0.0.001)

