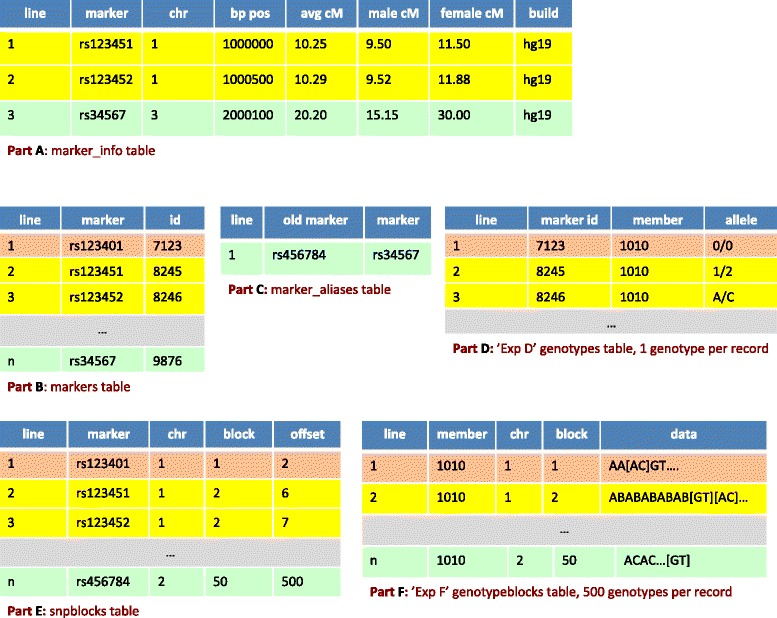
Figure 2.

An example of the marker look up process. The tan lines show a request for a specific marker. Next, the yellow lines show a request for markers by chromosome range. Finally, the green lines illustrate how the marker name and position can change. The 0/0 genotype in line 1 of Part D represents the missing genotype. The [ ] brackets in Part F point out the 6th and 7th genotype on line 2 and 500th genotype on line n; the brackets are not part of the genotype data.
