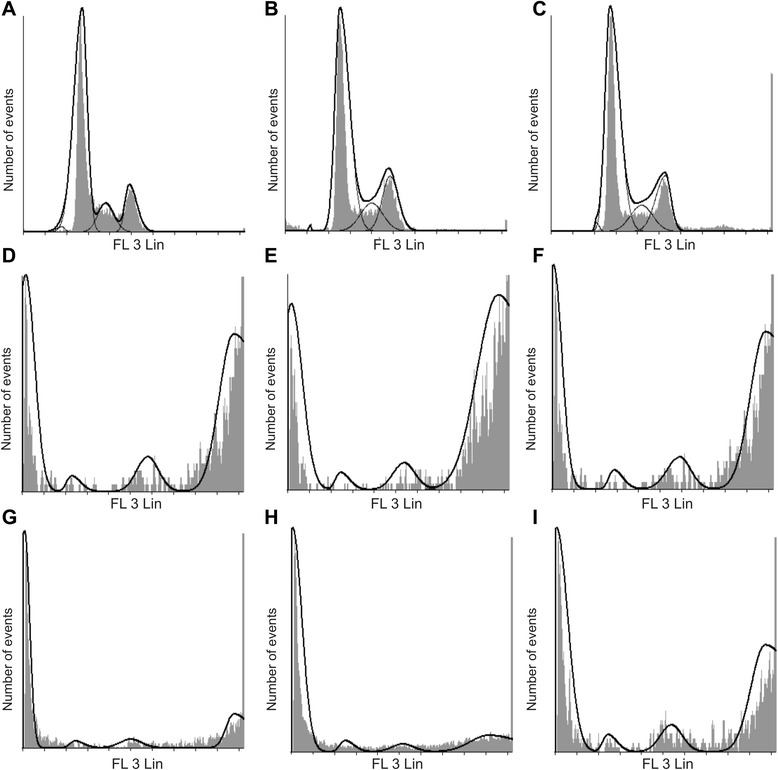
Figure 2.

Effects of EMBS on cell cycle progression. Flow cytometrical investigation using propidium iodide and ethanol fixation demonstrated cell cycle progression. Cell cycle progression of vehicle-treated MCF-7 (A), MDA-MB-231 (B) and MCF-12A cells (C) revealed the majority of cells occupied the G1 phase and S phase, less than 2% of cells in the sub-G1 fraction, and 13-19% of cells occupying the G2M phase. Treated cells were exposed to 0.4 μM for 24 h. EMBS-treated MCF-7 (D), MDA-MB-231 (E) and MCF-12A cells (F) revealed a statistically significant increased sub-G1 peak and a statistically significant increased number of cells occupied the G2M phase. Statistical significance was indicated on 3 independent experiments each performed in triplicate with a paired student’s t-test. MCF-7 (G), MDA-MB-231 (H) and MCF-12A cells (I) exposed to 0.1 μg/ml actinomycin D used as a positive control for apoptosis induction resulted in apoptosis induction and an increase of cells occupying the G2M phase.
