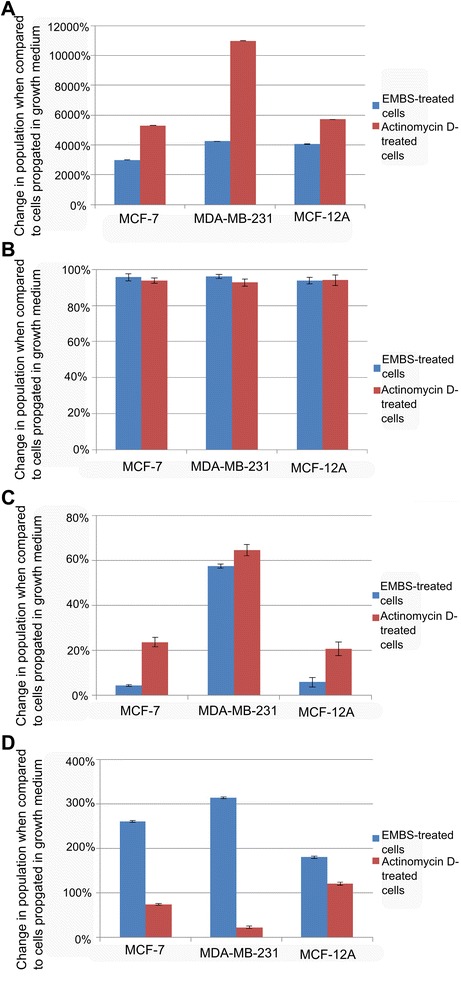
Figure 3.

Change in percentage sub-population when compared to cells propagated in growth medium. Percentage change after exposure to EMBS- and actinomycin D in the sub-G1 peak (A), G1 phase (B), S phase (C) and G2M phase (D). The percentage change in sub-G1 peak was significant after exposure to both EMBS and actinomycin D in all three cell lines. In addition, actinomycin D (positive control) resulted in a large percentage change in all three cell lines. The decrease in cells occupying the G1 phase after treatment to EMBS and actinomycin D resulted in a percentage change. The G2M phase experienced a large percentage change after exposure to EMBS in all three cell lines most prominently observed in the MDA-MB-231 cell line indicating that EMBS results in mitotic arrest.
