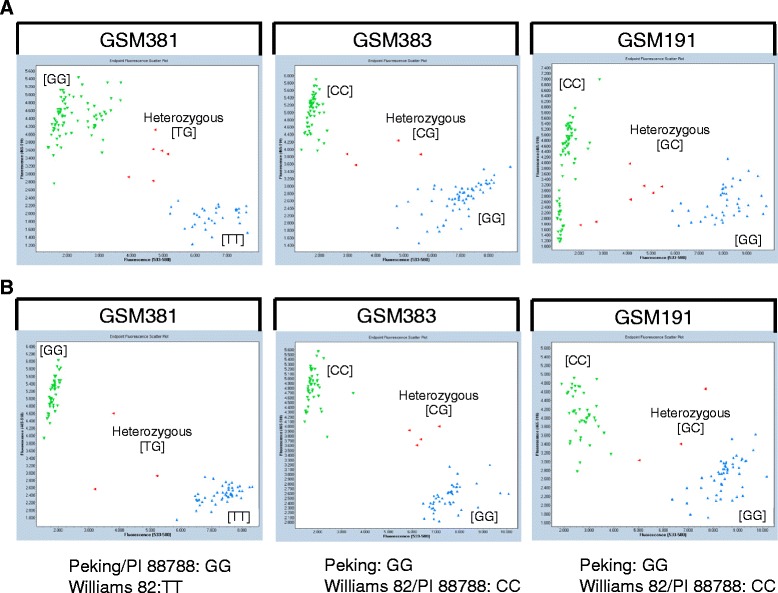
Figure 4.

KASP graphs of three SNPs for validation and precision genotyping test population. A. KASP SNP graphs of 153 soybean lines from 2011–2013 USDA Southern Uniform Soybean Tests with known SCN race 3 reactions. B. KASP SNP graphs of F5-derived RILs from the population derived from G00-3213 x LG04-6000.
